Close but No Cigar
Why using M2 alone as a Liquidity proxy doesn't quite cut it
Global liquidity (TLI) is a more powerful and timely indicator than M2 for Bitcoin and macroeconomic forecasting. Investors relying solely on M2 risk missing key turning points, as modern liquidity dynamics now encompass shadow banking, Treasury flows, and digital asset demand. For crypto markets, liquidity is the tide that lifts (or sinks) all boats.
This report brings up-to-date our analysis of Global Liquidity and its role in driving the economy and crypto markets. We draw comparisons with other metrics, namely M2 money supply.
Investors are in a phase where liquidity management, not just interest rates, determines market outcomes. US liquidity has become the central driver of asset markets since the early 2000s. However, the nature of US Federal Reserve and Treasury liquidity impulses has evolved. Conventional QE tools have been joined by unconventional mechanisms such as backdoor liquidity injections, short-term Treasury duration management, and stablecoin-driven demand for bills. These flows serve dual purposes: preserving financial stability and plugging growing fiscal holes.
Bitcoin and the Liquidity Gap
‘What drives Bitcoin?’ is a question we often return to. A head-to-head comparison between traditional M2 money supply and our broader global liquidity measure unambiguously favours ‘liquidity’.
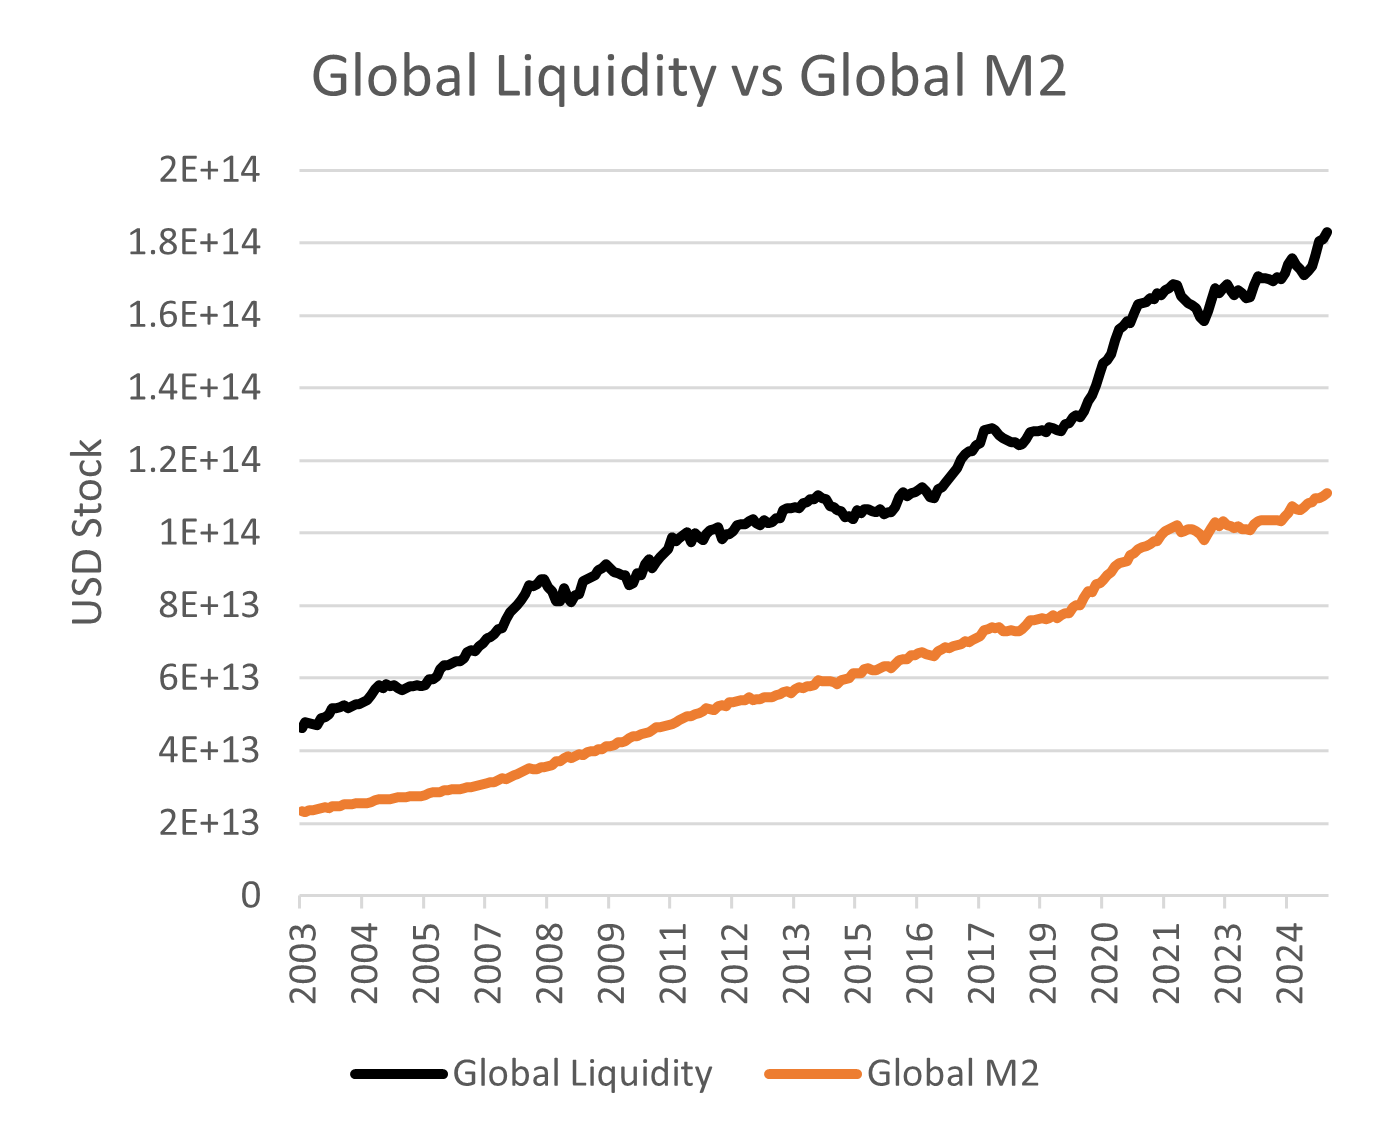
To recap, global M2 money supply, which represents a pool of approximately $110 trillion, measures bank deposits held by commercial banks. It excludes large and rapidly growing components such as shadow credit, collateralised repo, and other instruments central to financial markets. These excluded items form a major part of modern liquidity and bring the total to around $180 trillion. Figure 1 shows just how much information is missed by using M2 alone.
Figure 1: Global Liquidity Stock (USD Total) vs Global M2 Stock (USD)
Liquidity and M2 Economic Forecasting
To better understand the economic significance of liquidity and M2, we extended the comparison to traditional macroeconomic indicators. Specifically, we asked whether M2 or global liquidity provides stronger explanatory power for real activity.
Our first test focused on the relationship between the levels of each liquidity measure and key economic indicators. These included industrial production, non-farm payrolls, and the spread between ten-year and two-year US Treasury yields.
The table below presents the mean R-squared values for regressions of each indicator on TLI and M2, respectively.
Figure 2: Goodness of Fit and Statistical Tests of TLI and M2 on Economic Indicators
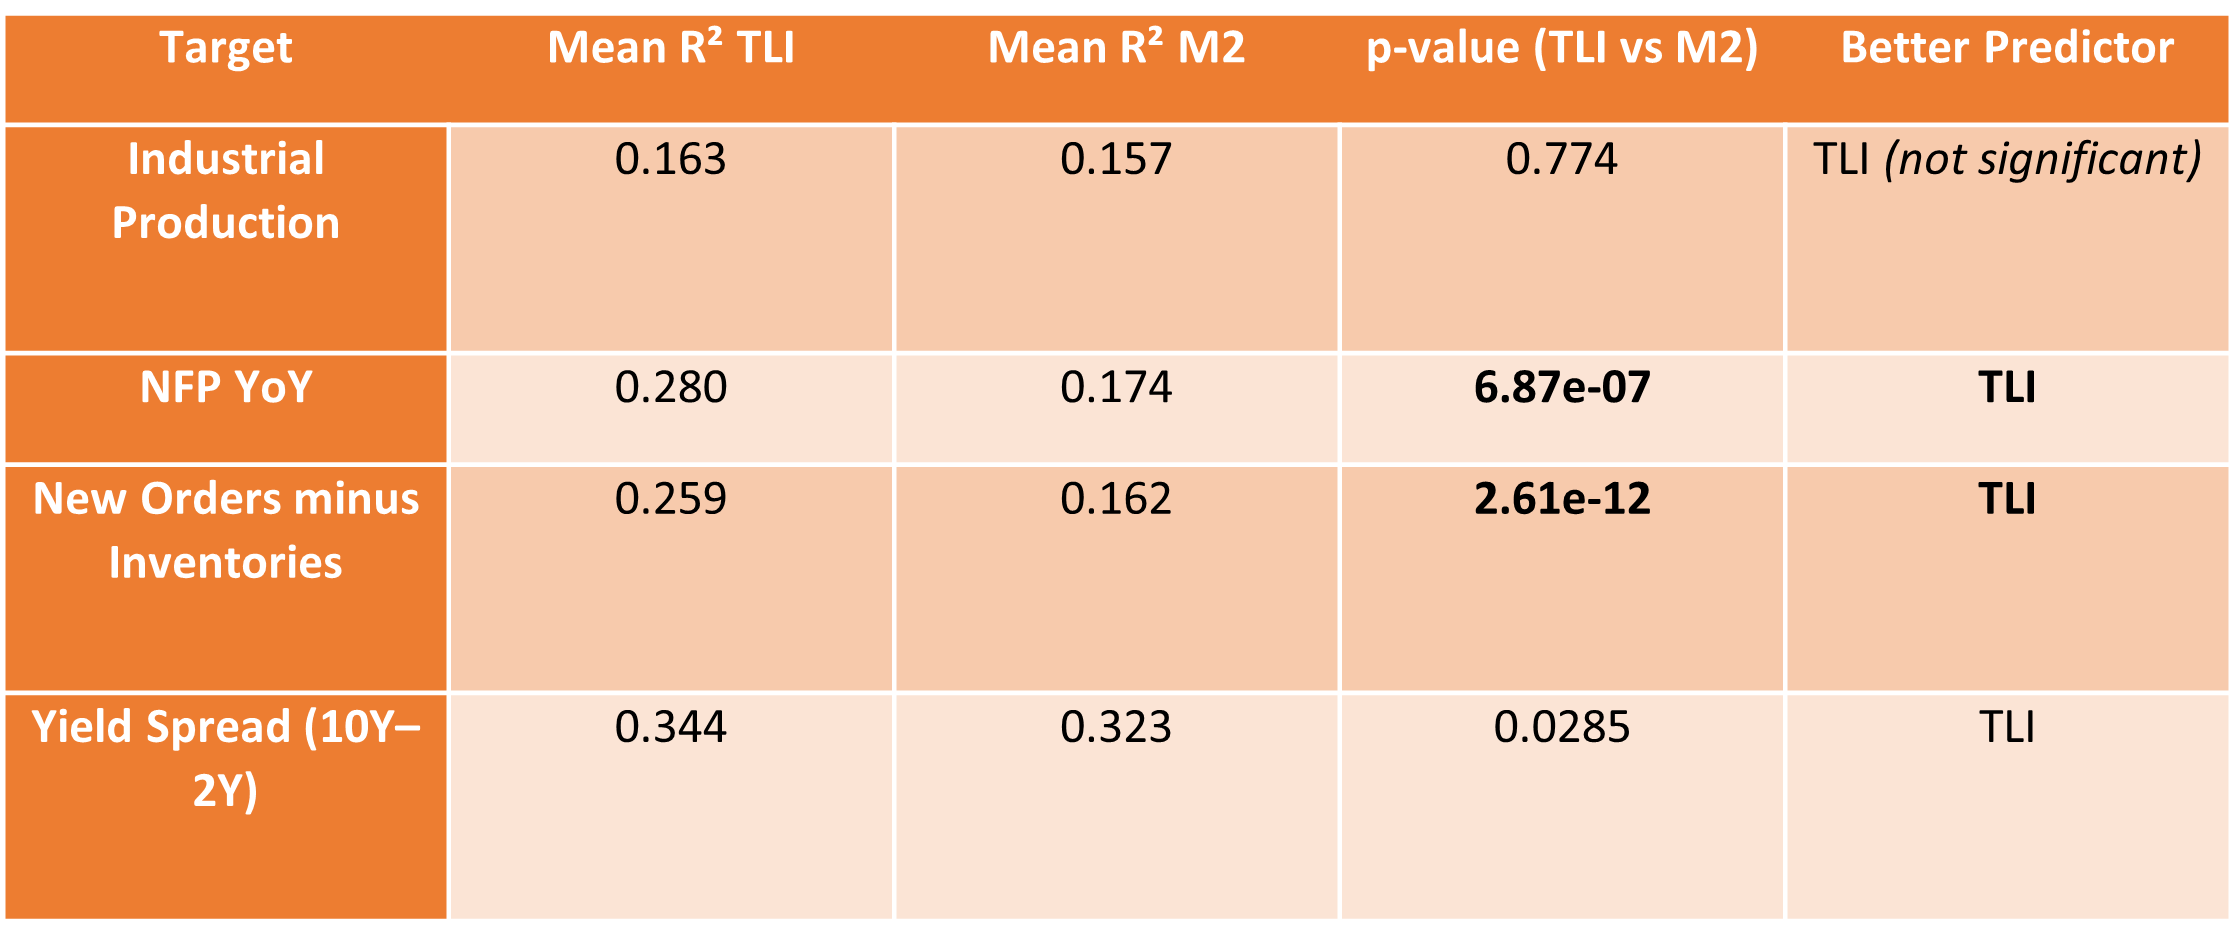
The outcome is consistent. TLI delivers higher explanatory power across the board. The most significant improvement is seen in non-farm payroll growth and in the new orders minus inventories component of ISM data—both classic barometers of economic momentum. Interestingly, the yield curve spread (10-year minus 2-year) is an area where M2 performs fairly well, registering a strong goodness-of-fit. This is not entirely surprising. M2 reflects changes in the deposit base and broader credit sentiment, both of which can affect expectations around interest rate policy and term structure. That said, TLI is better, both in explanatory power and in terms of statistical significance. The p-value advantage confirms that liquidity more accurately captures the evolving macro-financial backdrop that drives the curve.
Liquidity as a Leading Indicator
The analysis is more compelling when we look at forward-looking relationships. Specifically, we ask whether the three-month change in liquidity helps explain future moves in macro-sensitive variables. The focus here is on the US yield curve and Bitcoin.
We conduct rolling regressions over twelve-month windows, shifting the dependent variables three, six and nine months forward. This helps capture lead-lag structures.
The rolling 12m R-squared results for the 9m lead are plotted below in Figure 3.
Figure 3: Rolling R-squared Yield Curve (+9m) vs Global Liquidity and Global M2
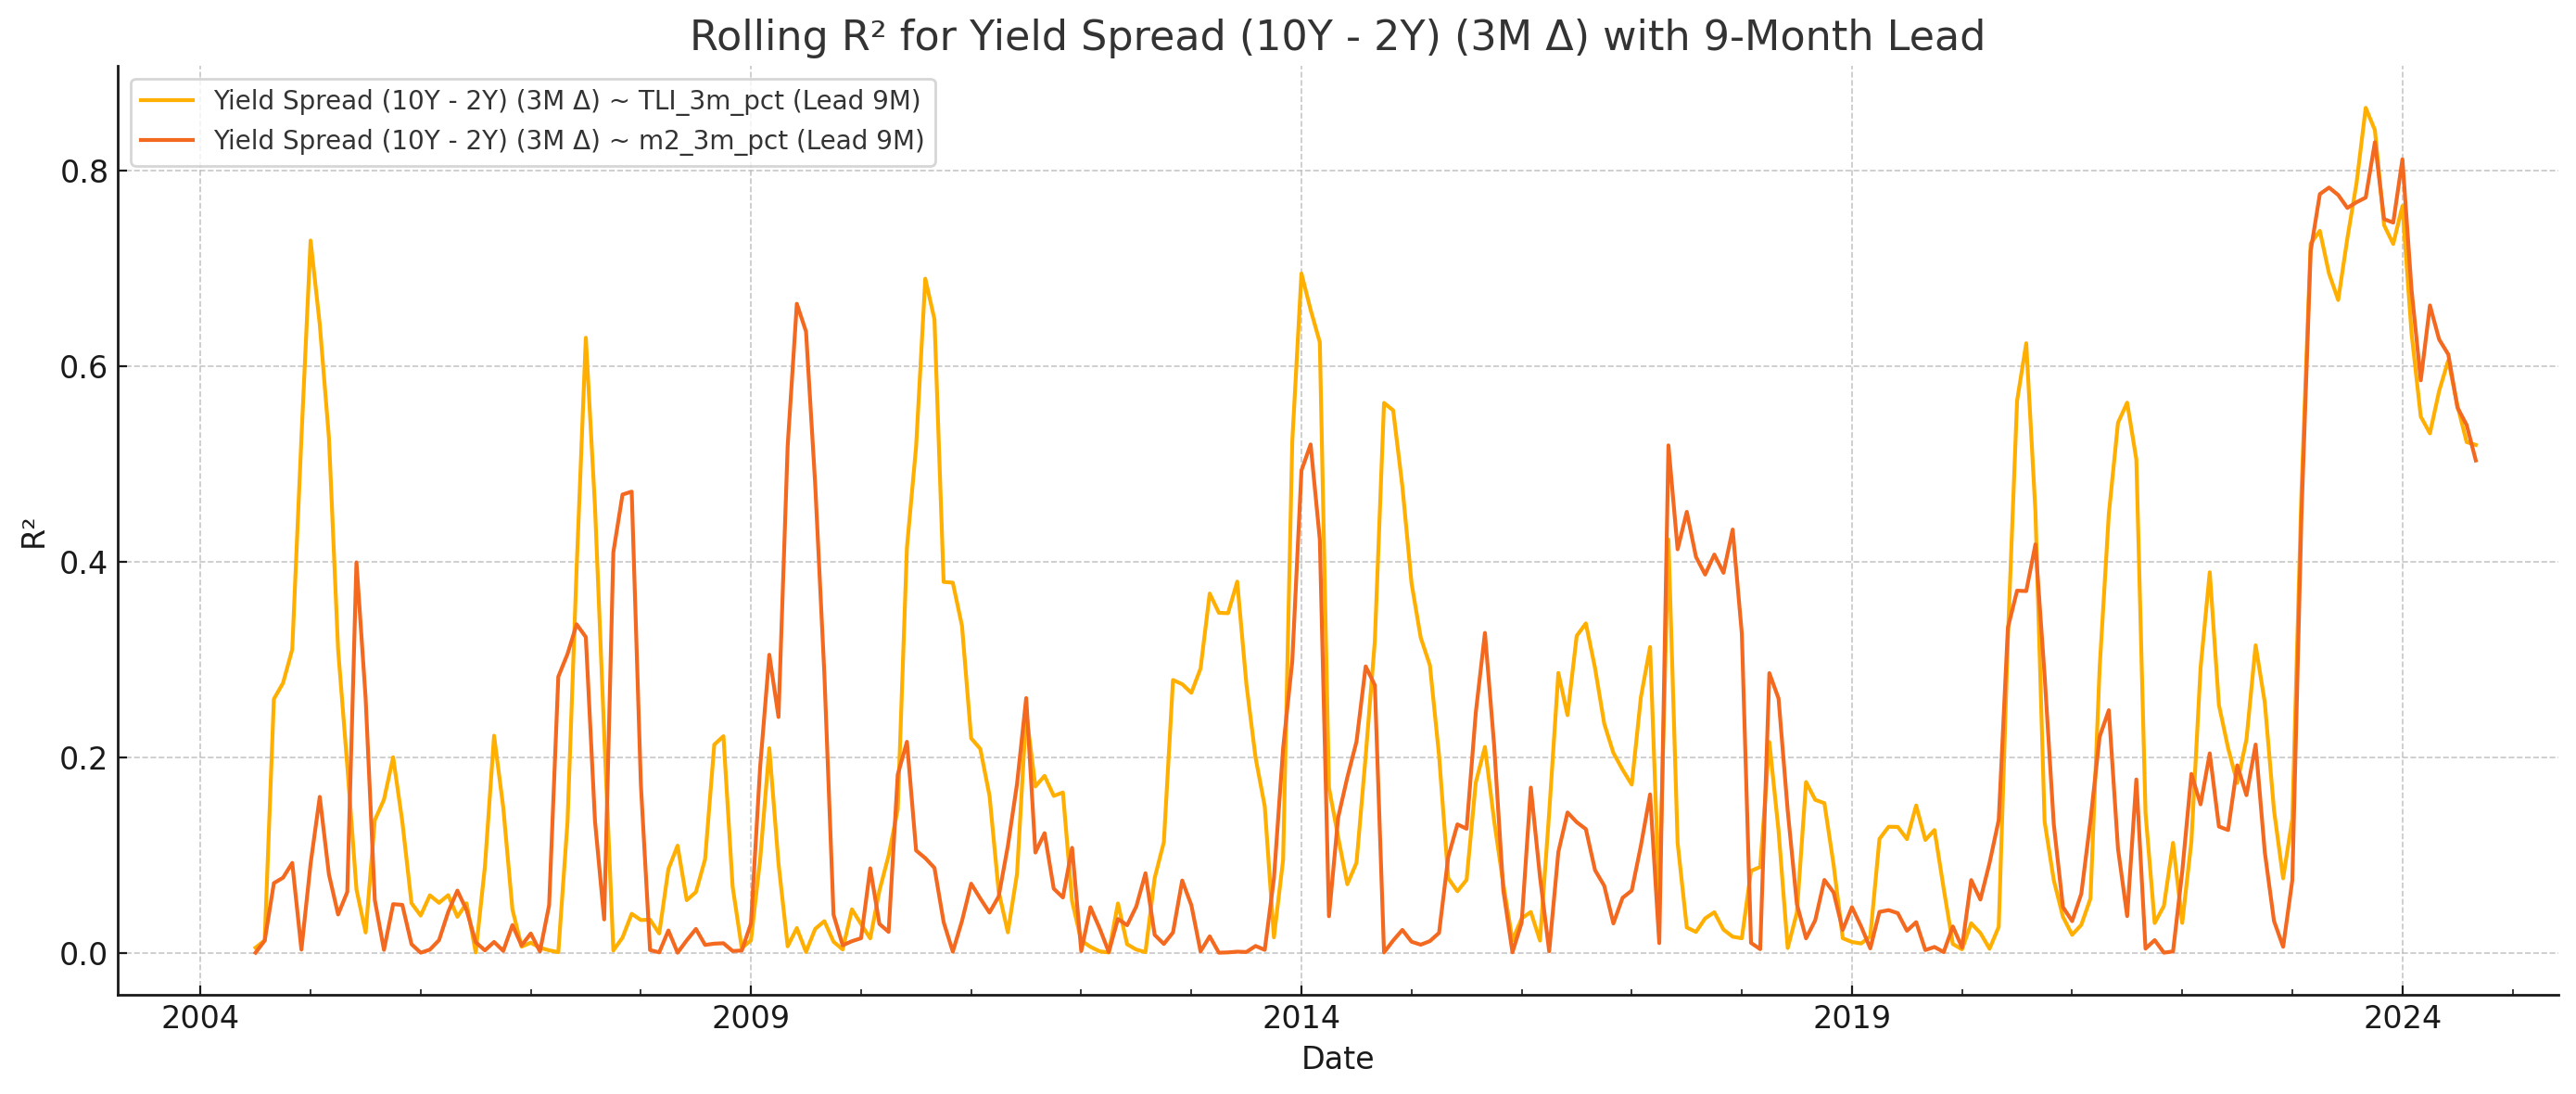
TLI clearly leads the yield curve with greater precision than M2. This superiority is not limited to specific episodes but holds consistently across time. The ability of TLI to anticipate turning points in the curve is particularly valuable, as these shifts often signal key changes in monetary policy and economic sentiment. Since early 2024, both liquidity and M2 have shown strong explanatory power over the yield curve. M2’s strength in this context may reflect its role in capturing deposit volatility and credit sensitivity as banking sector stress flared and policy normalisation faltered. However, the TLI advantage remains intact. Its predictive edge is maintained across regimes, aided by its broader inclusion of financial market liquidity, cross-border capital dynamics, and non-bank credit flows.
When we turn to Bitcoin, this time with a 3m lead time.
Figure 4: Rolling R-squared Bitcoin (+3m) vs Global Liquidity and Global M2
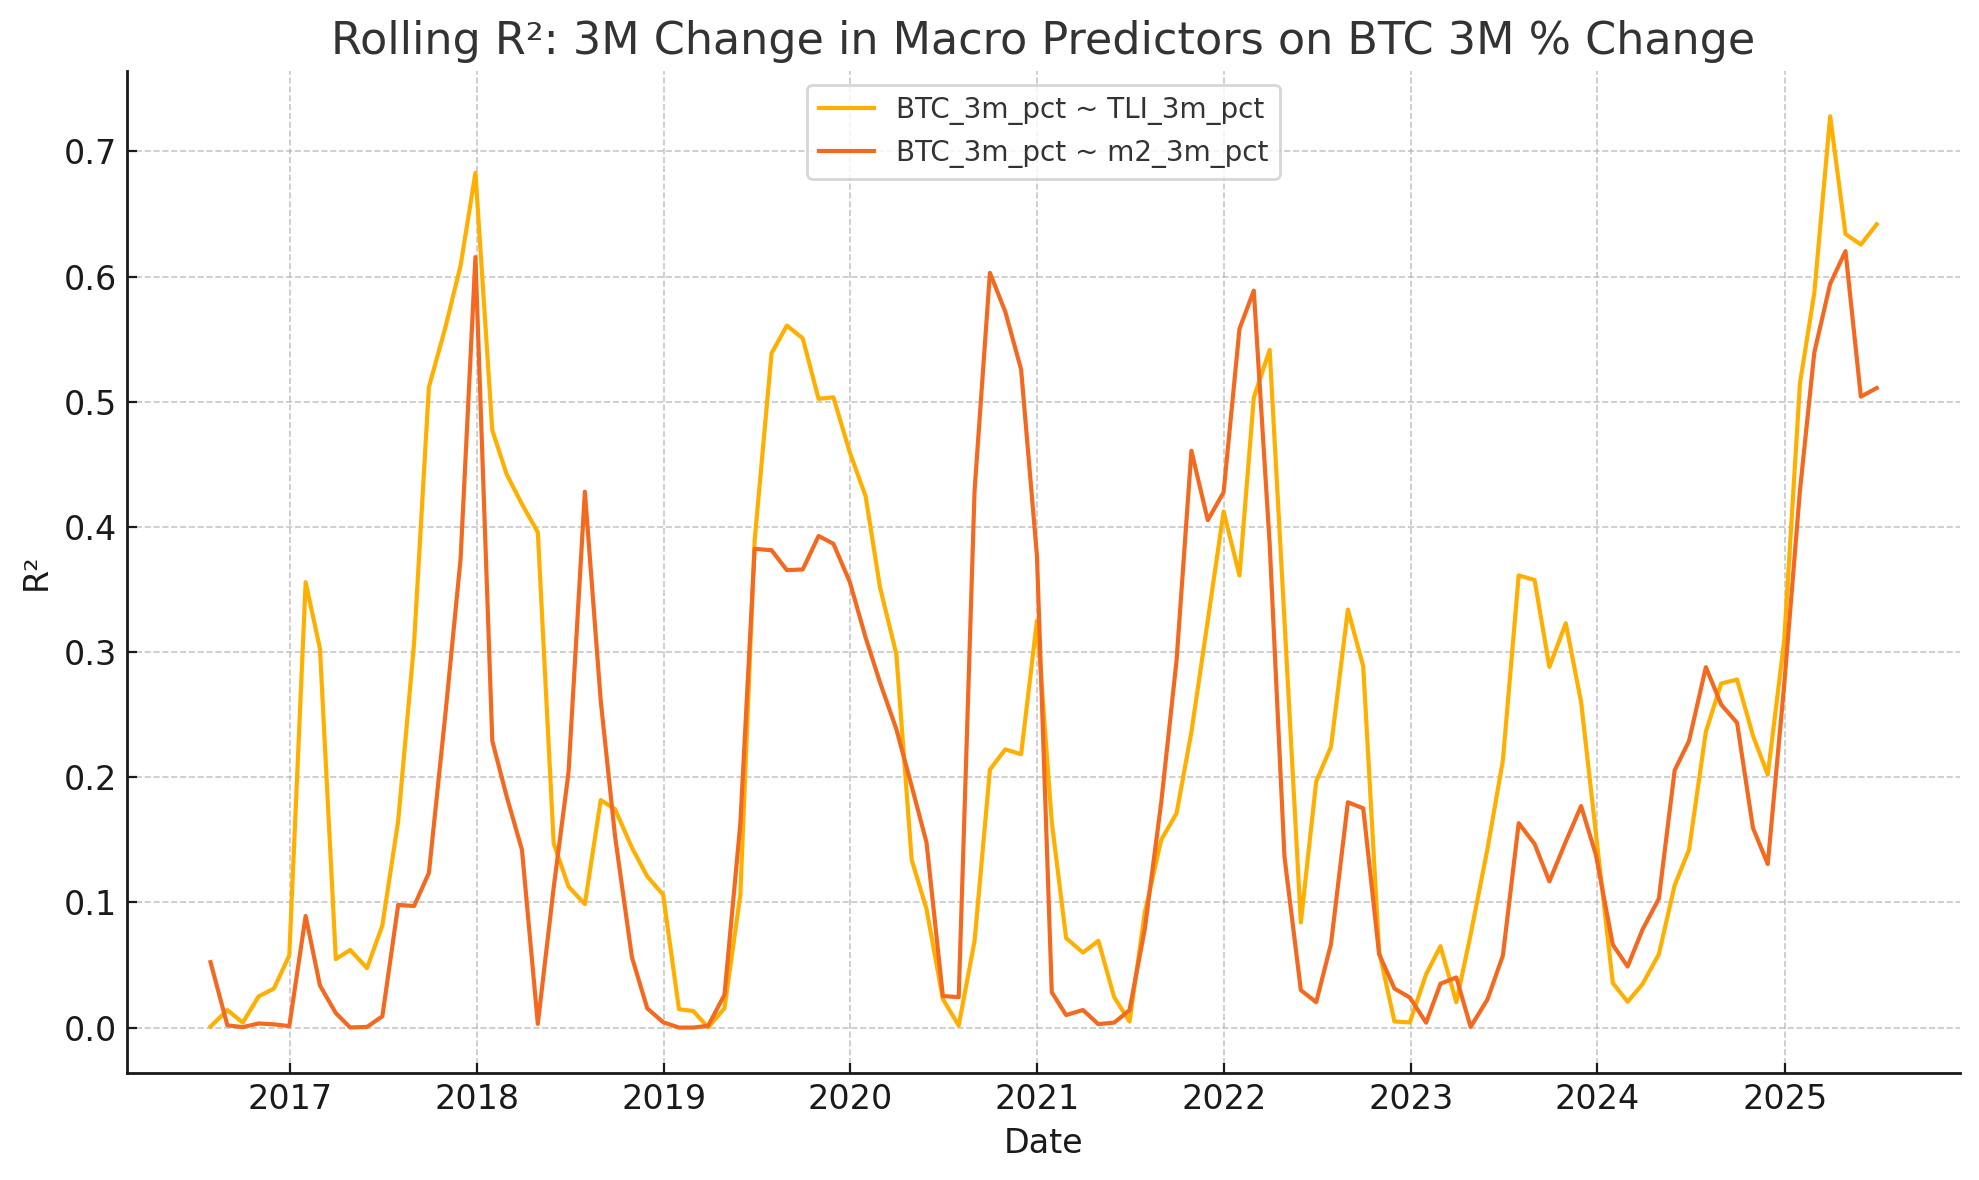
Global liquidity consistently outperforms M2 in explaining the path of crypto asset returns. Rolling regressions show that TLI captures a greater share of Bitcoin’s price variation across time, with superior performance particularly evident around inflection points. That said, both variables have become increasingly relevant in recent years, with a growing share of Bitcoin returns statistically accounted for by underlying monetary conditions. M2, while directionally useful, struggles to anticipate volatility clusters or liquidity-led revaluations. TLI, in contrast, has shown the ability to flag regime shifts with far greater accuracy, as demonstrated during the liquidity expansion of early 2020, the drawdown of 2022 and the bitcoin bull runs of 2023 and 2025. The stronger signal from TLI reflects its broader construction, which integrates financial market liquidity, shadow banking, and collateral conditions that directly affect speculative flows into crypto assets.
Impulse Responses Reinforce Liquidity’s Transmission Power
Our impulse response analysis provides additional confirmation that liquidity is the key transmission channel across macroeconomic and financial systems. These responses validate both the time horizon and relative strength of liquidity’s influence.
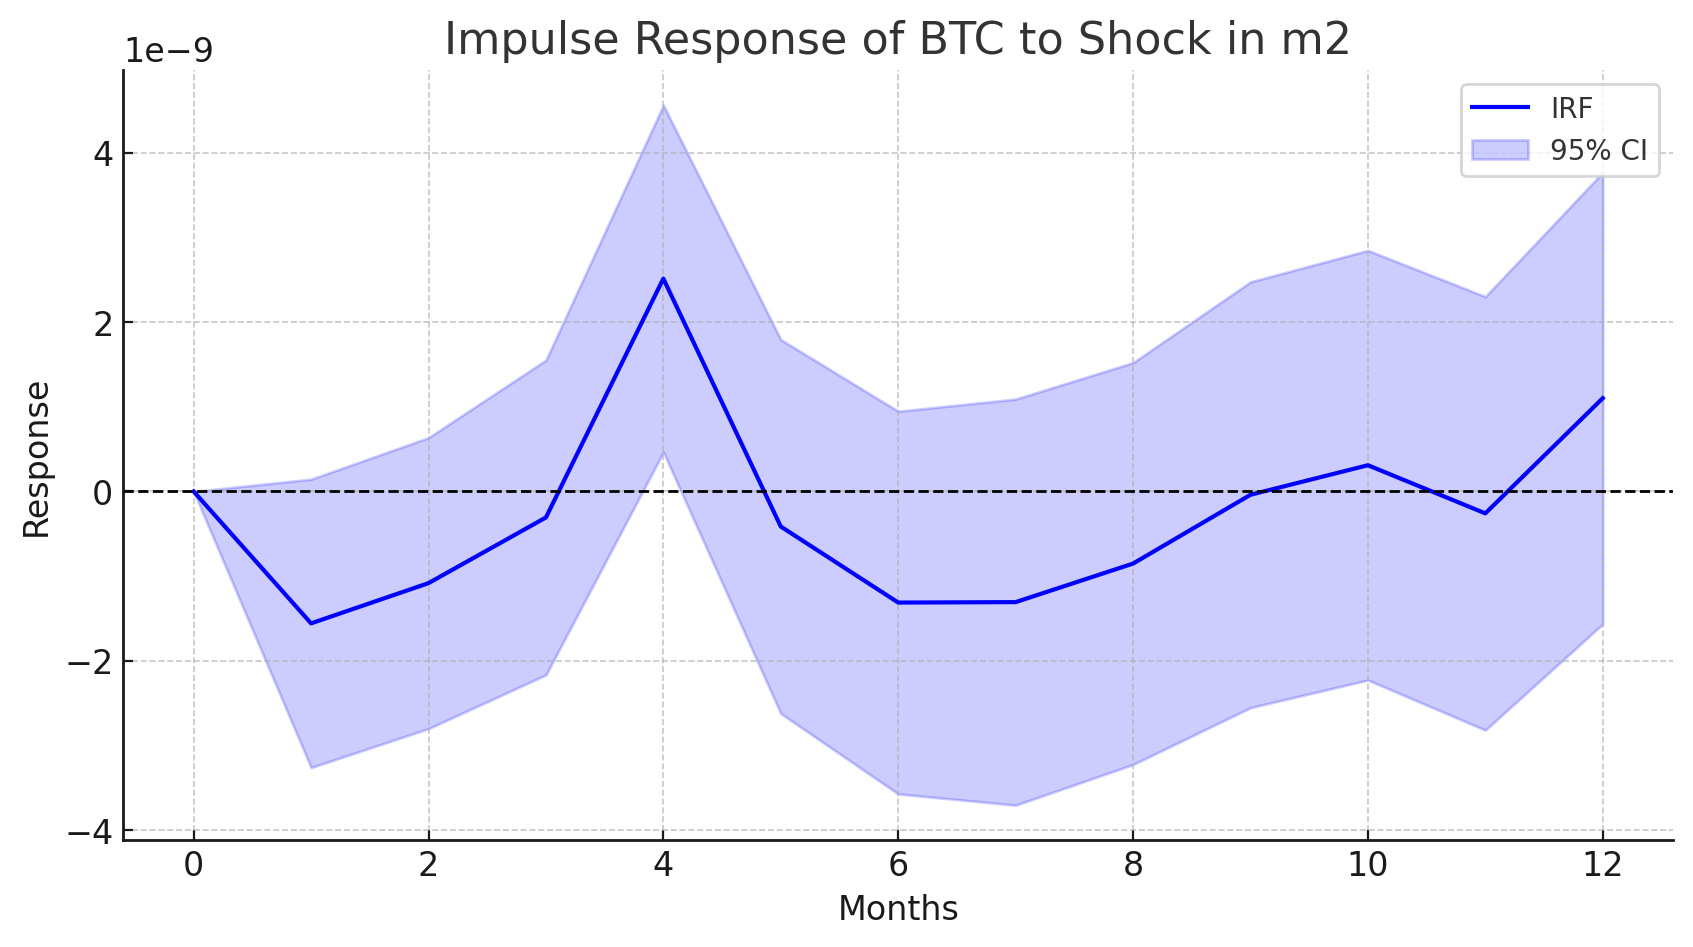
For Bitcoin, the clearest impact of liquidity changes emerges after a three-month lag. The impulse response chart shows a sharp and statistically significant response within that window, with relatively narrow confidence bands reinforcing the robustness of the signal. In contrast, M2 responses are weaker (note: y-axis has a multiplier of 1e-9) and more volatile, with wider confidence intervals and inconsistent directional impact.
Figure 5: Impulse Response Function of BTC to TLI shock
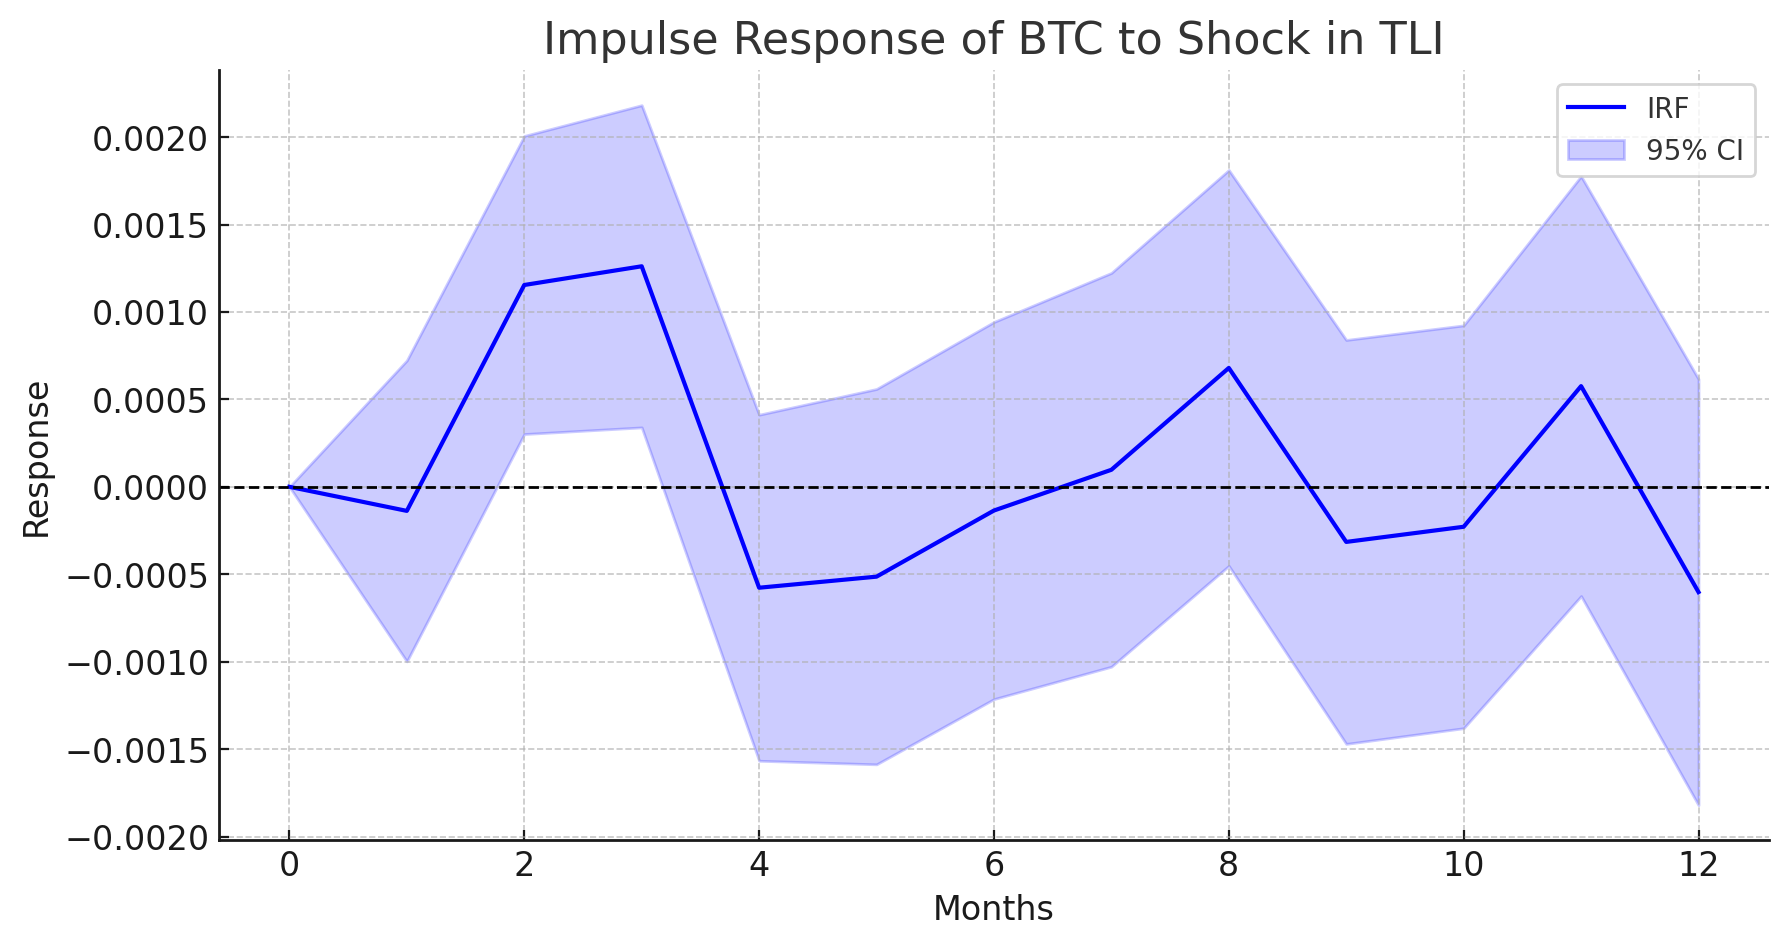
Figure 6: Impulse Response Function of BTC to M2 shock
Conclusion
M2 Is Too Narrow – Traditional M2 money supply (~US$110T) misses critical liquidity sources like shadow banking, repo markets, and Treasury flows, making it a lagging and incomplete indicator for markets.
Bitcoin Tracks Global Liquidity, Not Just M2 – Bitcoin’s price movements align more closely with broad Global Liquidity (TLI, ~US$180T), which captures hidden financial flows and provides earlier signals for crypto market turns.
Liquidity Leads Macro & Markets – Global liquidity (TLI) predicts key economic indicators (jobs, yield curves) at a 9-month lead and Bitcoin at a 3-month lead, outperforming M2 in timing and accuracy.
Modern Liquidity Goes Beyond QE – Today’s liquidity is driven by unconventional tools like Treasury bill issuance, stable coin demand for short-term debt, and shadow banking—factors that amplify financial stability risks and fuel crypto rallies.