Bitcoin’s Volatility Shift Through a Golden Lens
Using gold’s historical volatility decline to understand Bitcoin’s path toward macro legitimacy
Bitcoins Structural Re-anchoring
Bitcoin's volatility regime is undergoing a transformation. Much like gold in previous decades, what was once a whirlwind of erratic price behaviour is settling into something more disciplined, more macro-anchored. In this piece, we explore the parallels between Bitcoin and gold's volatility history, dissect changing correlations between Bitcoin and fiat currencies, and conclude with empirical evidence of structural shifts in the sources of Bitcoin's realised volatility. The result is a growing case for Bitcoin as a maturing asset class, no longer solely defined by its speculative excesses.
Gold's Volatility: Then and Now
To understand Bitcoin's volatility arc, it helps to look back to gold’s trajectory through the latter half of the 20th century. In the years following the collapse of Bretton Woods, gold experienced explosive volatility. Between 1970 and 1980, annualised realised volatility exceeded 35%, driven by rampant inflation, geopolitical upheaval, and the newfound freedom of floating exchange rates.
However, as monetary policy credibility improved and inflation expectations became more anchored, gold's volatility steadily declined. From 1985 onwards, realised volatility fell dramatically, averaging closer to 15% through the 1990s. Gold transitioned from a volatile hedge into a store-of-value asset, supported by structural shifts in macro policy regimes.
An important and often overlooked driver of this transition was the evolving role of central banks. Even without the United States, global central bank gold holdings increased by 1,256% between 1970 and 1995. This marked a dramatic shift in reserve management philosophy—one that reclassified gold not only as a hedge, but as a core reserve asset. As more central banks integrated gold into their portfolios, demand steadied, speculation declined, and volatility structurally subsided. Figure 1 shows the huge accumulation of gold by global central banks (ex US) between 1970 and 1995.
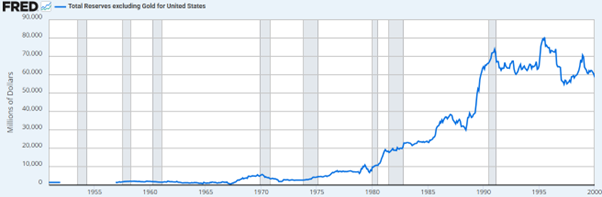
Source: Fred
This is the precedent we see now unfolding with Bitcoin. See Figure 2 below for gold's realised volatility by 5-year periods from 1970 to 1995 against 2-year periods from 2014-2025 for Bitcoin.
Bitcoin: Realised Volatility Then and Now
Using rolling realised volatility data, we calculate Bitcoin’s annualised vol over two-year intervals from 2014 onwards. What is immediately apparent is a steady decline in peak volatility, with the most recent 2024–25 period showing the lowest realised vol since inception. A subplot comparing this evolution to gold between 1970 and 1995 shows striking similarity. Both assets experienced a multi-year period of extreme volatility before gradually settling into lower regimes, with periodic flare-ups.
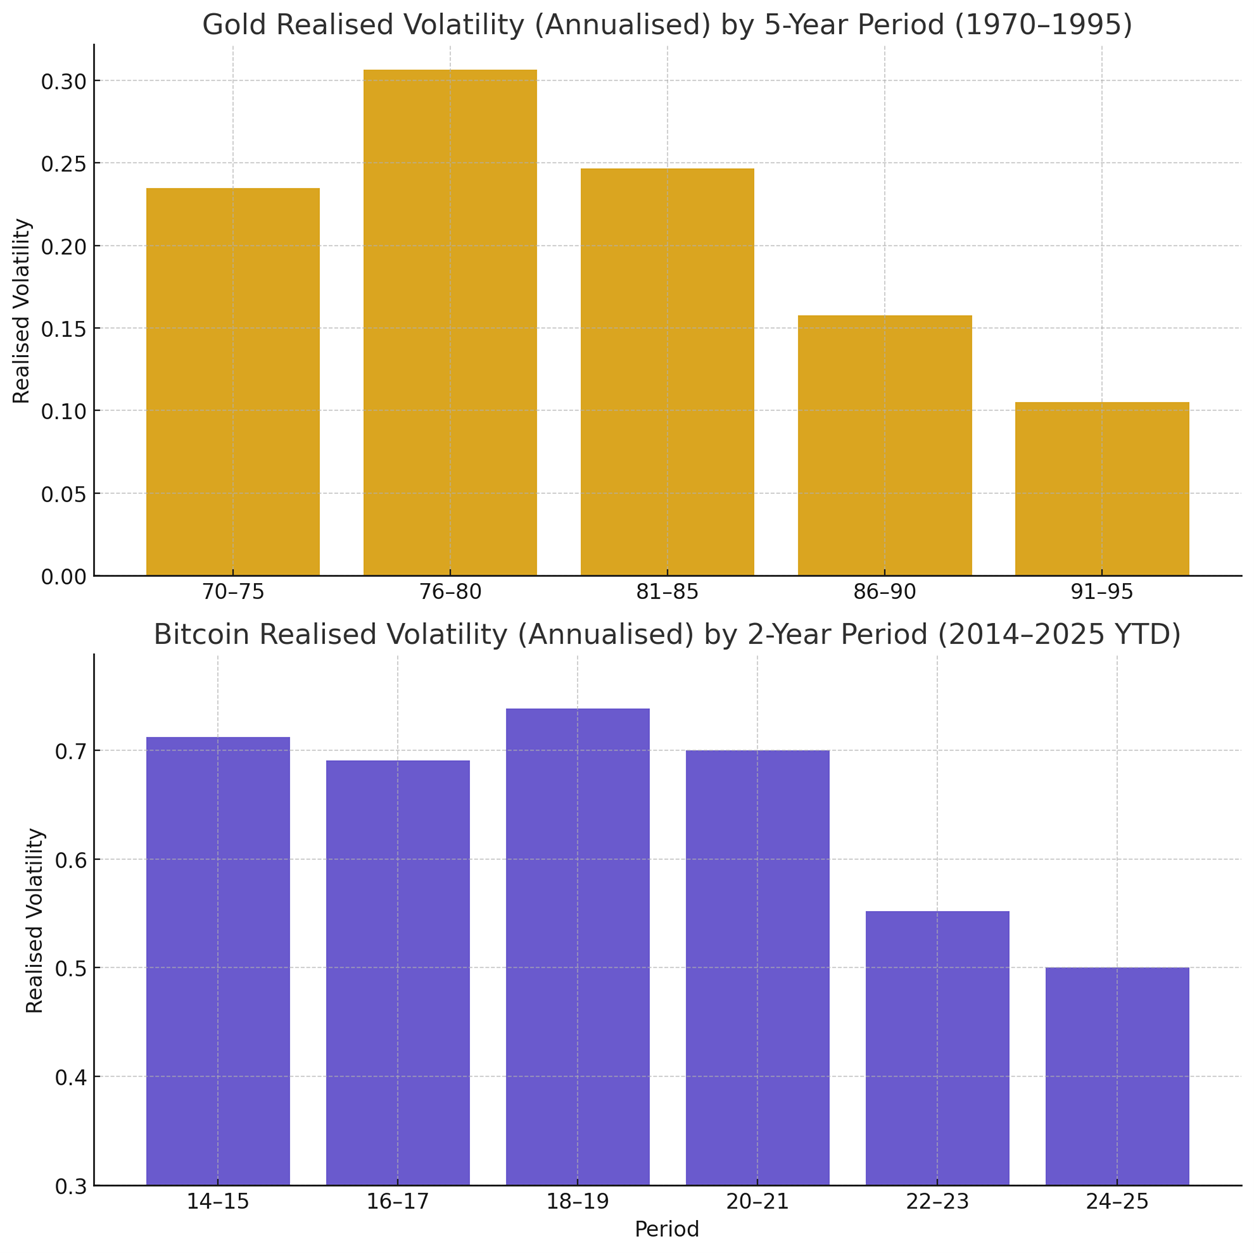
Source: CrossBorder Capital, Bloomberg
Bitcoin is evolving beyond trend and momentum. It is establishing the risk and return profile of a core macro asset, with its own set of structural drivers. The near-term signal remains bullish. But the long-term implications are more important: Bitcoin is becoming independent. The most recent 2024–25 period shows Bitcoin approaching its all-time low in annualised realised volatility, based on a 21-day rolling window. Notably, Bitcoin has managed to avoid the sharp volatility spikes that have plagued fiat currencies this year. Figure 3 shows a side-by-side comparison of Bitcoin’s rolling volatility against the DXY, underscoring Bitcoin’s growing resilience to global macro shocks.
Figure 3
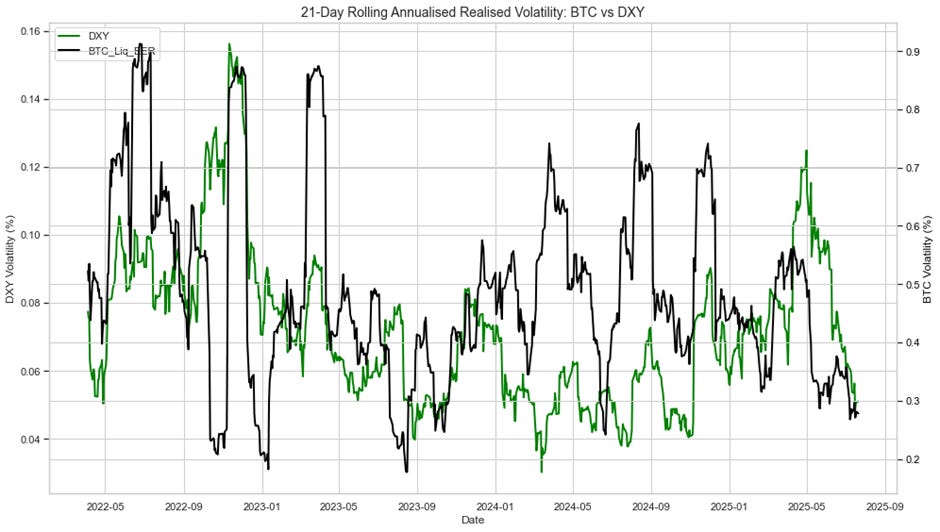
Source: CrossBorder Capital, Bloomberg
Critically, we are beginning to see echoes of the gold adoption cycle through the lens of central bank behaviour. Emerging market central banks have not yet added Bitcoin to reserves in significant quantities, but proposals are increasingly surfacing. Policymakers in El Salvador, Pakistan, and the Czech Republic have publicly discussed or drafted frameworks to allocate up to 5% of their reserves to Bitcoin. And notably, discussions within US policy circles increasingly include the potential for future Bitcoin holdings in reserve frameworks. As reserve demand for Bitcoin stabilises and broadens, the macro anchoring that subdued gold’s volatility may increasingly apply to Bitcoin as well.
Shifting Correlations with Fiat Currencies
From 2022 to 2025, our FX correlation matrices show a clear transition in Bitcoin's fiat linkage. Initially, Bitcoin's return correlations with fiat currencies were erratic and low. However, a shift is evident from 2023 onwards, where Bitcoin began exhibiting stronger co-movements with pro-cyclical commodity currencies such as AUD and CAD, while showing persistent negative correlation with the US Dollar. See Figure 4 for cumulative return correlations.
Figure 4:
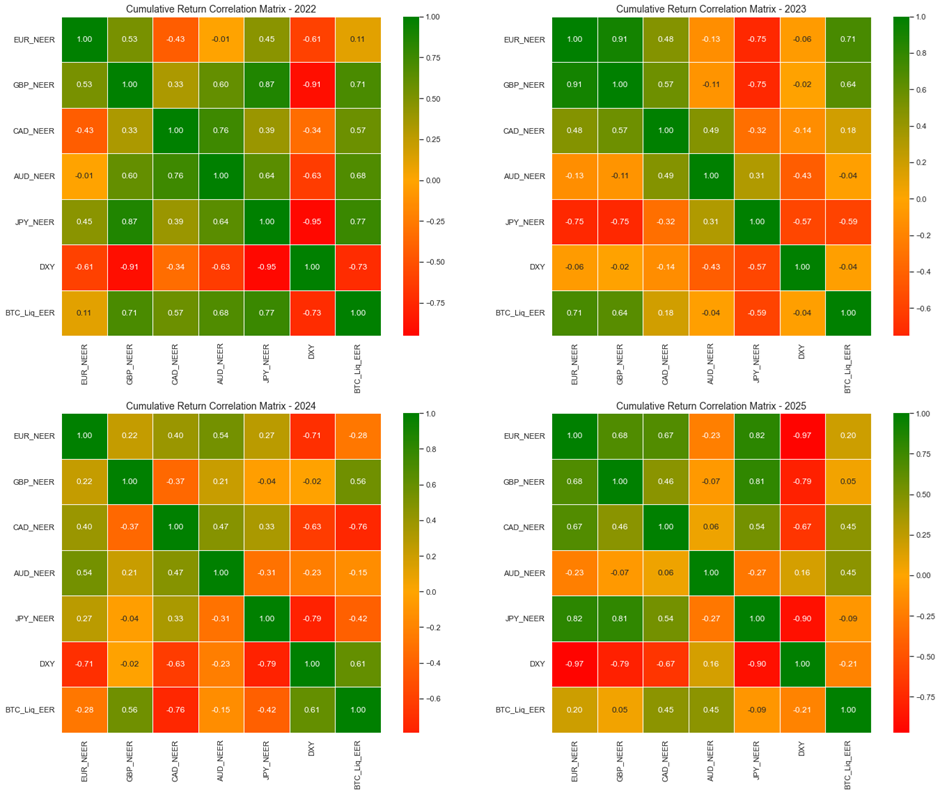
Source: CrossBorder Capital, Bloomberg
This mirrors gold’s behaviour during periods of liquidity expansion. As noted previously, these changes are further reinforced by the evolving correlation between BTC and global liquidity indicators, which show heightened alignment in both return and volatility dimensions. See Figure 5 for Global Liquidity Implied Bitcoin Price vs Bitcoin.
Figure 5:
Source: CrossBorder Capital, Bloomberg
The HAR Model: A Diagnostic Tool for Volatility Structure
To investigate the underlying structure of Bitcoin’s volatility, we apply the Heterogeneous Autoregressive (HAR) model. The HAR framework models current volatility as a function of lagged short-term (daily), medium-term (weekly), and long-term (monthly) realised volatilities. In theory, this allows us to dissect whether recent shocks or longer-term macro conditions are more predictive of future volatility.
When fitted to Bitcoin data from 2014 to 2020, the model shows strong explanatory power from short- and medium-term lags, indicating a market dominated by fast-moving speculative behaviour. However, from 2021 to 2025, the dynamics change. The short- and medium-term coefficients weaken substantially, while the long-term coefficient becomes the dominant input. This structural re-weighting suggests that Bitcoin volatility is increasingly driven by broader macroeconomic and liquidity cycles, rather than noise or technicals alone.
Our side-by-side coefficient bar chart (Figure 6) confirms this re-anchoring. Long-term volatility explains a much larger share of future volatility post-2020, while short-term predictive power almost disappears. This is classic behaviour of an asset transitioning into maturity.
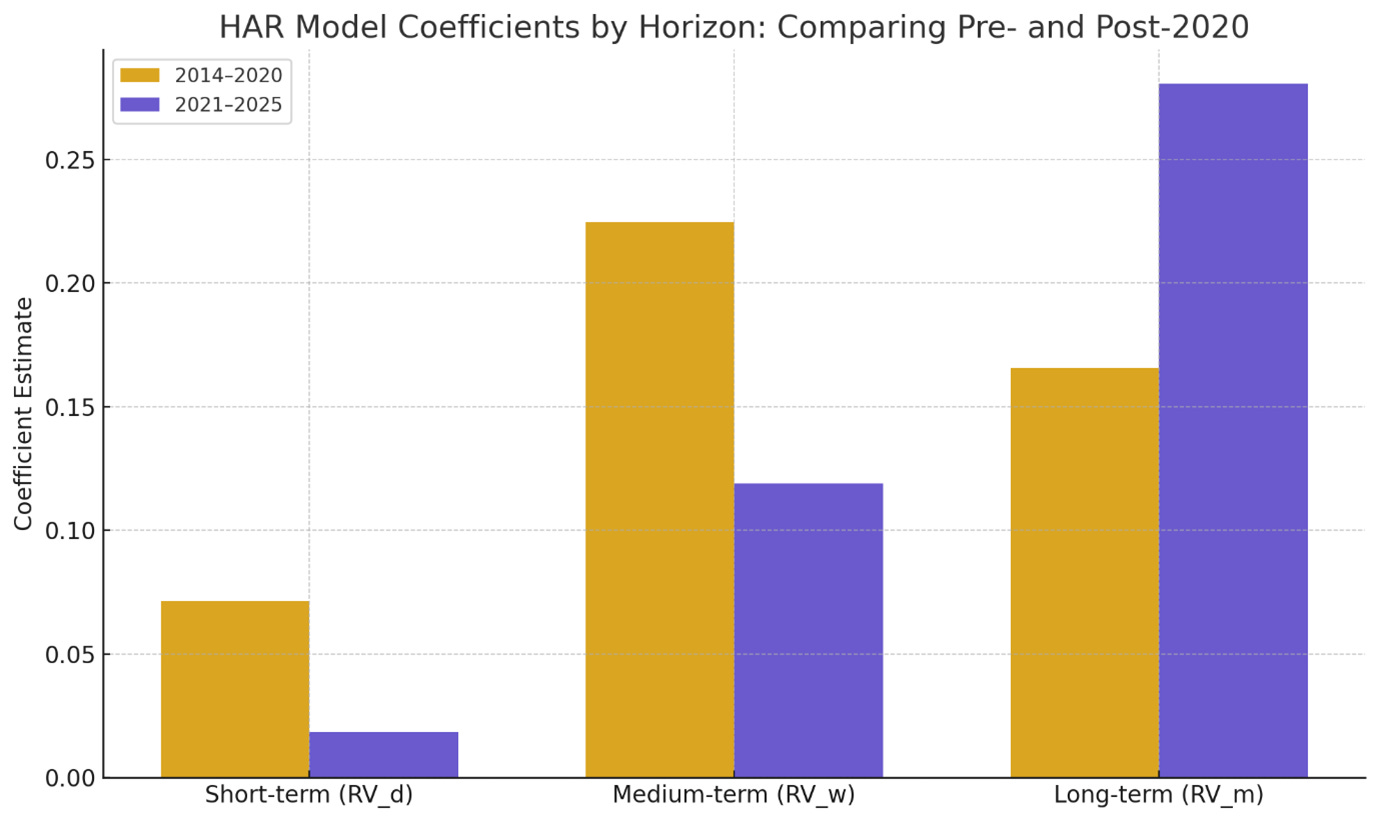
Source: CrossBorder Capital, Bloomberg
A New Volatility Base for Bitcoin
Three separate lines of analysis point to the same conclusion: Bitcoin is evolving. The comparison to gold is not merely superficial. Both assets experienced high-volatility birth phases that gradually gave way to more stable, macro-driven regimes. Bitcoin’s increasing correlation with global FX, particularly with cyclical and liquidity-sensitive currencies, reinforces its transition from a speculative token to a systemic asset. And now, like gold in the 1980s and 1990s, we are witnessing the early stages of central bank interest in Bitcoin as a reserve alternative—further reducing speculative influence and amplifying structural demand. Finally, the HAR model provides statistical confirmation that the volatility base has shifted from short-term speculation to long-term macro structure.
In a world where volatility often equates to uncertainty, Bitcoin remains volatile, but this volatility is increasingly informed by structural drivers, offering a more strategic role in macro portfolios.